Charts and graphs can be published in the same manner as standard reports after executing your Report Definition.
To publish your chart or graph:
1. Execute the chart or graph from the Report Definition.
2. If you did not select to execute the Report Definition as a chart or graph by default, select the Display as Chart option from the context ribbon on the Report View workspace.
3. Once the chart or graph is displayed, publish the report using the Publish option on the Report Definition’s Chart Context ribbon.

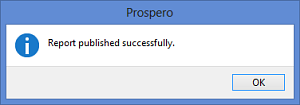
4. Once publishing the report has successfully completed, you will receive a confirmation message.

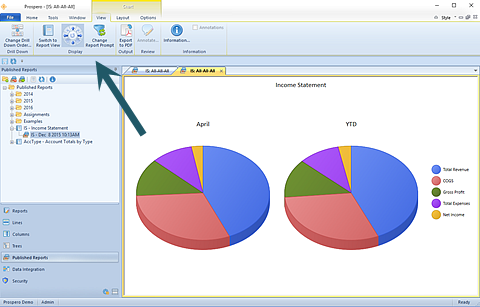
5. The Published Report will appear in the folder selected for the report in the Published Reports Navigation Pane.
6.
Select the desired Report Definition and then click the  option to open the report and display it
in your Published Reports workspace.
7. The published chart or graph report will render in the Published Reports workspace with the Chart View context ribbon.

Published charts and graphs follow the same rules and behaviors for modifying and deleting the published reports.
Note: Your published report will always run for the format which you originally published it for, either row-and-line or chart/graph formats.
For more information, see the sections Modifying Published Reports and Deleting Published Reports.