Unless you’ve chosen to render your report as a Chart by default, which is an option set in your Report Definition, you can optionally view your report as a chart or graph. (Remember, to set your report to be viewable as a chart or graph this option and the chart type must be selected on the Report Definition Options Tab.)
To view a report as a chart or graph:
1.) Select the Display as Chart option from the Report View context ribbon when the report is rendered.

2.) The report will then display as the chart type you defined in your Chart Layout tab.

When running a report in Chart View, Prospero will display one chart display for each of the columns that are enabled for displaying on charts. Pie, Donut and Torus Chart types will show a separate chart for each column in the report that isn't suppressed.
Also, the Header values shown on your chart report will be determined by whether or not you have defined specific Column Headers OR if you’ve defined values for the Labels on Charts field in the Column Definition.
3.) The Chart context ribbon will appear when the report is opened as a chart. This context ribbon will display three possible tabs of information (depending on your chart or graph type).

Features on this ribbon are grouped logically in sections. The View tab section includes the following:
•Configuration – This section contains the report configuration functions to manage the Line, Column and Report Definitions that make up your report. The Open All option will open the associated sets with a single click on the selection.
•Display – This section contains options for report display when the report is in graphical format:
The Rotator option to allow you to rotate your chart or graph in any direction.
Switch to Report View will render the report in a standard column and line mode.
The Re-open Report option allows you to re-run the report using different report parameters.
The report will open in the Reports Workspace in addition to the report which was just executed.
•Drill down method – This section contains the report option to Change Drill Down Order on the report.
•Output - This section contains the options output your report to various sources:
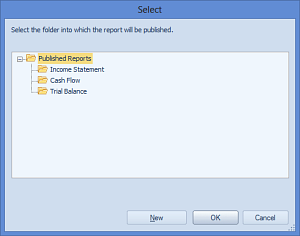
The Publish option allows you to Publish Reports to preserve the report in its current state based on the parameters and data for which the report was executed.

The Export to PDF option allows you to export your report directly to a PDF file. When the Export to PDF option is selected, when you run your report, you will be provided with a default file name corresponding to your Prospero report file. (You can also enter a new name for your PDF worksheet. Invalid characters in filenames are: \ / : * ? " < > | If you enter these characters, they will be replaced with an underscore.)
After specifying the location and name, select the Save button and your report will open in a PDF document as it appears in Prospero. All Prospero report formatting options - font type, size, alignment, colors and borders – as defined in the Line, Column or Report Definitions will carry over to your document.
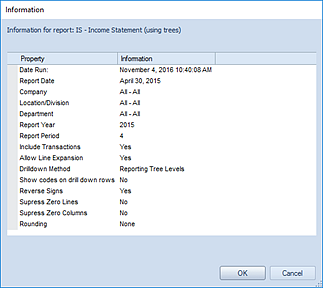
•Information – This option returns report information such as when the report was run, the report parameters, report year and report period.
